

Post Covid Investing: Time for a Deeper Look
As the worst of the pandemic gradually recedes, investors are going to be bombarded with statistics that will, on their face, seem outlandish.
Year over year comparisons will be stunning in notional terms. Economic indicators will also post extraordinary readings. But, like most things, true understanding requires a deeper examination, which is an important prerequisite to making smart, impactful decisions.
First, consider the speed and depth of the plunge last year. The stock market hit its cyclical low 57 weeks ago. The Dow Jones industrial Average and S&P 500 dropped 34 percent and 36 percent respectively, between February 19 and March 23,2020. At the time, no one knew how the virus would play out, and no one knew where the bottom was for equity prices.
Last year’s recession was mechanically driven, resulting from lockdowns in an effort to contain the pandemic. Policy makers then introduced massive stimulus packages to minimize the economic fallout. So, keep that in mind when you begin hearing about tremendous gains in portfolios or individual companies over the past 12 months.
At the end of 2019, we were concerned that stock market valuations were getting ahead of themselves, as stocks were generally becoming expensive relative to their earnings. Fast forward to this year; the S&P 500 just crossed above 4,000 – an all-time high. While the S&P 500 has smartly advanced off the March 23, 2020 low, the top-line advance of the index does not nearly reflect the extreme volatility of various sectors and industry groups that comprise the benchmark as a whole.
A deeper look will show that during the first three calendar quarters of 2020, which include just over six months of gains off the pandemic-induced low, technology stocks – as represented by the XLK Technology exchange traded fund (ETF) – were up 27.3 percent. The companies which comprise that sector ETF came to represent the bulk of the work-from-home group of stocks in the S&P 500. The other sector ETF that performed extremely well was XLY (consumer discretionary stocks), but that was due primarily to Amazon’s inclusion in that group.
It was a narrow cluster of companies that led XLY to post 17.2 percent YTD gains through Sept. 30, 2020. Many consumer discretionary firms were under tremendous pressure, but the sheer size of Amazon and a handful of other positive performers led to the gain. Conversely, during that period, the worst performing sectors of the S&P were energy stocks(XLE – 50.1 percent YTD) and financial companies (XLF – 21.8 percent through the first nine months of 2020).
The wide dispersion points to the need to peel back the data to perceive the whole picture, but through the first quarter of 2021,technology stocks are the worst performing sector in the S&P 500, and consumer discretionary stocks are the third-worst out of 11 groups. The very best performers: energy (+30.3 percent) and financials (+16.4 percent).
While the headline numbers are interesting, the sector rotation beneath the surface tells the rest of the story: stocks are now pricing in a “reflation” trade and the reopening of the economy. Investors must consider whether purely passive investing makes sense for them when so much churn and sector-to-sector volatility are taking place beneath the surface.
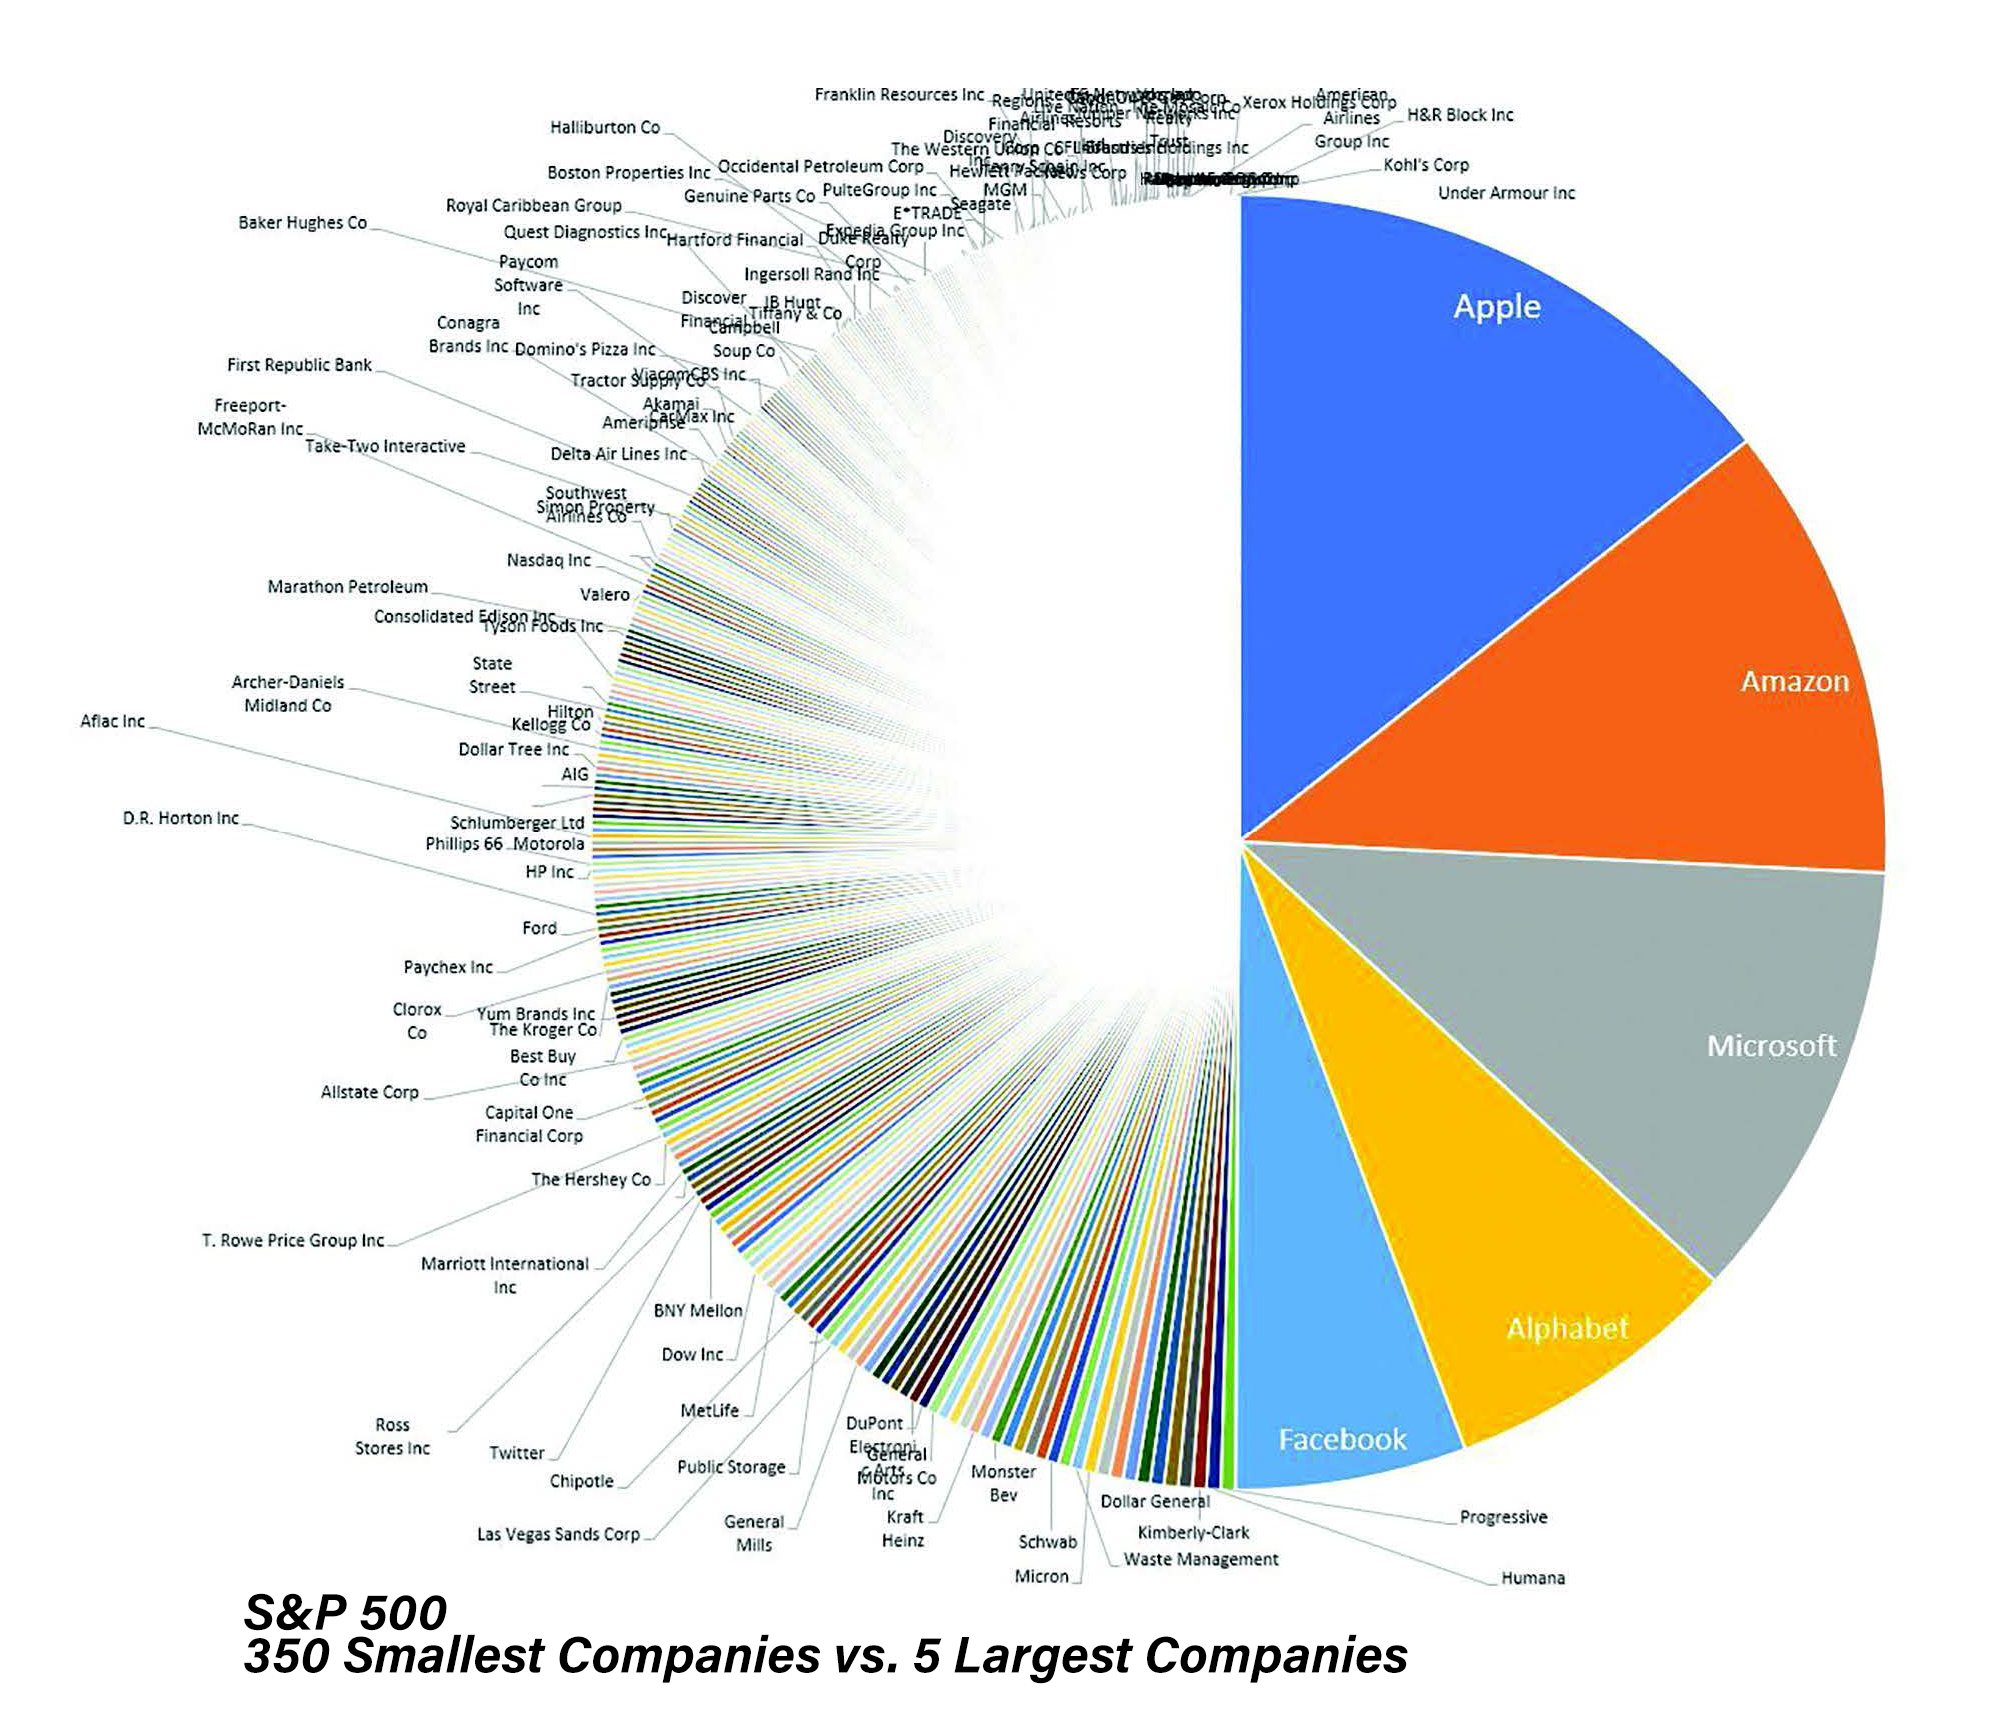
At the same time, investors should question whether the S&P 500 is as prudent an investment as it appears. The Index has become far more concentrated as the mega-cap technology companies have increased their absolute size (in terms of market capitalization) and weighting within the index on a relative basis.
The top five companies now represent approximately 25 percent of the total market capitalization of the S&P 500, which means that approximately 495 companies comprise the other 75 percent. If diversification is a key to managing risk, a deeper look is crucial.
In addition to equity market gains, current and leading economic indicators will reflect a higher shift. Some measures, like the Purchasing Managers Index (PMI) or those which capture manufacturing and industrial output, report their results in straightforward terms or on an established scale. Other measures, like inflation (the CPI – Consumer Price Index), are reported on a relative basis (percentage change, period over period). It’s important to frame statistics
in their proper context.
For instance, for many years, the Bureau of Labor Statistics (BLS) calculated the cost of a basket of goods with quantities and qualities fixed and reported the changes monthly. That has since evolved into a cost-of-living index, which accounts for quality changes and substitution effects (like eating more chicken if beef becomes too expensive). The results are still published monthly, along with a rolling 12-month average.
Inflation data is about to break out to the upside. But before individuals get too concerned about rampant inflation, consider how the CPI is calculated: it’s like a roll of Lifesavers, and each month the oldest month in the data drops off the back, replaced by the new, current reading. When the low monthly figures from January, February and March 2020 fall out of the index, the new average will naturally drift higher. Things got so bad in April 2020 that the monthly CPI figure was negative. Thus, the current inflation spike is as much about low and negative readings a year ago as it is to a rise in prices today. We expect this surge in inflation to be temporary.
Covid-19 has accelerated the digital transformation of the economy and disrupted international supply chains. Outsourcing and globalization have probably already peaked, as Covid-19 exposed the fragility of international supply chains. Realigning those supply production chains closer to home may introduce a short-term measure of inflation. But in the long run, some deflationary factors, such as automation, robotics and artificial intelligence, have also become stronger.
Finally, the current economic expansion may be shorter than the typical 14 quarters of growth. Since the last downturn was artificially induced, a case can be made that we’re actually just picking up where we left off pre-Covid-19. And we will be looking beneath the surface for indications that may contradict the popular narrative of another “Roaring 20’s decade.” That’s one of the reasons why our clients trust us with their assets. We stress test our ideas with a variety of assumptions to make sure we’re delivering the best fiduciary advice to our customers. Maybe it’s time we helped you take a deeper look, too.
Scott Ehrig is the Chief Investment & Trust Officer at F&M Trust
Recent Articles
Join our e-newsletter
Sign up for our e-newsletter to get new content each month.


